Understanding innovation partnerships: social network analysis
Innovation in agriculture flourishes when diverse and multiple actors put knowledge to use through collective thinking and action. A better understanding of such complex and dynamic interactions is crucial to plan more effective capacity development interventions for strengthening agricultural innovation systems. Social Network Analysis is practical and useful in this regard. It can be used to assess linkages in an innovation network and to monitor their development over time.
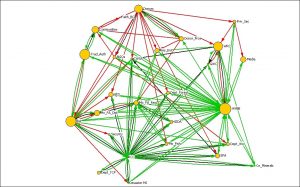
Social Network Analysis to assess innovation capacities
Social Network Analysis (SNA) is a process of quantitative and qualitative analysis of social structures. It characterizes networks in terms of nodes – representing individuals, groups, organizations or institutions – and the ties that connect them. In the context of an innovation network, it allows measuring and mapping the relationships and relationship changes between the stakeholders in the network. Specific data for the SNA can be collected through various methods, including stakeholder mapping and network questionnaire.
This factsheet is part of a series outlining tools and approaches to promote more effective capacity development for Agricultural Innovation Systems (AIS). These tools and approaches put to use the principles of the Common Framework of the Tropical Agriculture Platform (TAP), a G20 initiative. They are applied through the Capacity Development for Agricultural Innovation Systems (CDAIS) project, funded by the EU and jointly implemented by Agrinatura and FAO in collaboration with national partners in Angola, Bangladesh, Burkina Faso, Ethiopia, Guatemala, Honduras, Laos and Rwanda.
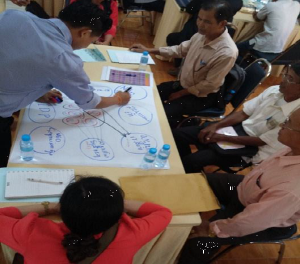
Stakeholder mapping is a participatory pen-and- paper method that actively engages workshop participants and requires good facilitation. Stakeholder mapping helps to determine in a participatory manner the stakeholders involved in a given innovation network, how they are linked, how they work together and how they influence each other. This method can also help to identify the boundaries of the network, as well as possible bottlenecks and opportunities.
A network questionnaire is an alternative tool to collect data on innovation processes. It can be used to collect information, through interviews or online surveys for example, on a wide range of linkages type. Collected data is provided in a format that can be easily used for further analysis. However, this method offers less of a learning experience than stakeholder mapping. Participants cannot visually identify actors, linkages and the nature of relationships at the time of data collection.
Once the information is collected, comprehensive SNA is best performed by processing the data with a specialized software.
How to organize data collection in the field?
Stakeholder mapping and network questionnaire were used in the context of the CDAIS project to collect data on innovation partnerships in selected countries. On the basis of this experience and the Net-Map methodology, concrete guidelines with a number of steps to apply both instruments are proposed.
Stakeholder mapping
At the start of a stakeholder mapping session facilitators should clearly define:
- who are the actors to represent on the map;
- what type of linkages should be represented;
- what level of detail is needed.
The following steps are then suggested:
- Represent individuals and their names on the map as well as their affiliation with a specific organization (individuals are thus clustered by organization on the map). If more appropriate, one can also simply represent a network of organizations (without referring to individuals and their names);
- Define clearly on the map the actors who are physically present at the workshop;
- Focus initially on relationships among participants and between participants and third party actors not taking part in the workshop. Where known, later represent on the map relationships among third party actors;
- Draw connecting lines if two actors are in contact with each other. Add little arrows to the lines to signal information exchange and collaboration;
- If participants are too many to jointly work on one map, divide the participants into groups and then combine the different maps into an overall network which needs to be validated by all participants.
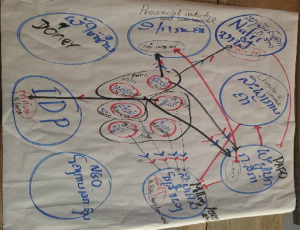
Stakeholder mapping as part of a CDAIS capacity assessment workshop in Laos
Network questionnaire
A network questionnaire can be used to collect data on innovation network properties. The table below refers to data gathered during a workshop to assess an innovation partnership in Rwanda. It shows only the names of workshop’s participants. It is also possible, however, to collect names of third party actors who did not attend the workshop – if this information is deemed important.

Network questionnaire used for CDAIS capacity assessment workshop
It should be noted that it might be counterproductive to engage workshop participants in excessive data collection. Preliminary knowledge of issues and challenges can help to identify the types of linkages that matter most in a given context, and focus the questionnaire on those types of linkages. Just like the output of the stakeholder mapping, it is essential to validate any network created from data collected with the help of a questionnaire.
How to analyze data?
There are many software options available to analyze data collected through stakeholder mapping and network questionnaire. NodeXL (https://nodexl.codeplex.com) is an Excel add-in, while Gephi (https://gephi.org) is a widely used stand-alone open-source software. GraphCommons (https://graphcommons.com) is a practical web-based solution for basic SNA. It was chosen to visualize innovation networks during CDAIS workshops in Laos and Rwanda. The table below shows how data from stakeholder mapping in Laos fed into a spreadsheet. Information was later imported into the Graph Commons software to display the actors (nodes) and their linkages (edges). In this case weights were not used.

Spreadsheet with data from stakeholder mapping in the format that can be imported into GraphCommons
The figure to the right shows the network of a rice innovation partnership in Laos, compiled from the data collected through three pen-and-paper maps. The nodes represent individuals. The larger is the size of a node, the bigger is its influence on the flow of information. Larger nodes are the ones whose removal will most jeopardize communication in the network. Since the map was compiled by merging three pen-and- paper exercises, linkages, especially among participants (in pink) and among other actors (in green) are missing.
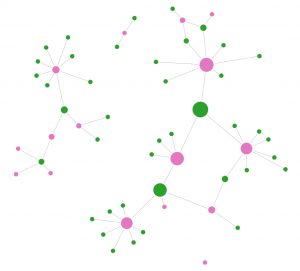
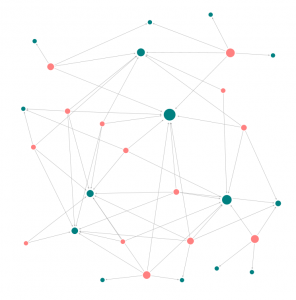
The data collected through the network questionnaire is processed, using the Graph Commons software, in the same manner as the data obtained through stakeholder mapping. However, the nature of these data (displayed in the figure to the left) is slightly different from the Laos data shown above. Nodes represent assessment workshop participants (in red) and organizations (in green); while edges represent information exchange relations for the innovation partnership (example from Rwanda).
Following that, stakeholders involved in the partnership should get together and validate the network map.
Sources: https://netmap.wordpress.com/about/ (IFPRI).
For more information on the different CNA tools and approaches, check TApipedia and the NIF Training Manual.
